

Cost and Value of Renewables (Mixing Questions, part 2)
Cost and Value of Renewables (Mixing Questions, part 2)
Renewables have the cost edge over fossil fuels - despite intermittency

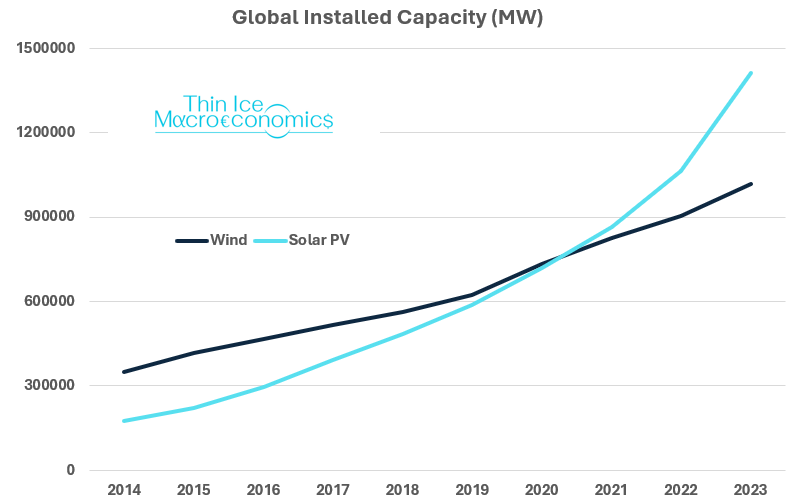
source: Thin Ice Macroeconomics based on data from IRENA
In my previous post on climate change I discussed the challenge that intermittency (or variability) of renewables - the fact that the sun doesn’t always shine and the wind doesn’t always blow - poses for decarbonizing electricity production.
I looked at various technical solutions that will enable us to further increase the share of renewables in electricity generation - dramatically, if we are to stand a good chance of avoiding a climate disaster.
Now, technical solutions are one thing.
But a big question is: what about cost? Readers will recall that decarbonizing our economies requires cleaning up electricity production in tandem with expanding electrification to almost all activities - that’s a big push.
In other words, to make informed decisions about the costs and benefits of abating climate change, it’s not enough to look at the engineering possibilities - we also need to look at economic feasibility.
A good place to start is with a cost comparison of different electricity generating technologies.
It turns out that here, too, the intermittency of renewables is a key issue.
Or rather, the technical challenges that arise from intermittency have a reflection in the economic sphere: the fact that sun and wind are free does not mean that the cost of energy is zero, even in a world where we have fully deployed renewables capacity!
And the intermittency issue is important if we want to make a proper cost comparison of different electricity generating technologies. If we don’t, we could end up with distorted conclusions.
That’s what I want to tackle in this post.
Cost competition
I suspect many readers will be aware that electricity generation from renewables is already “competitive” with - cheaper than - hydrocarbons.
This piece of information is not difficult to come across in quality publications such as The Economist, for example, and many daily newspapers. (Incidentally, on this and many other sustainability-related issues, I can’t recommend
’s blog and book highly enough.)For the latest data, the International Energy Agency’s 2023 World Energy Handbook is the source to consult for such things. So here goes:
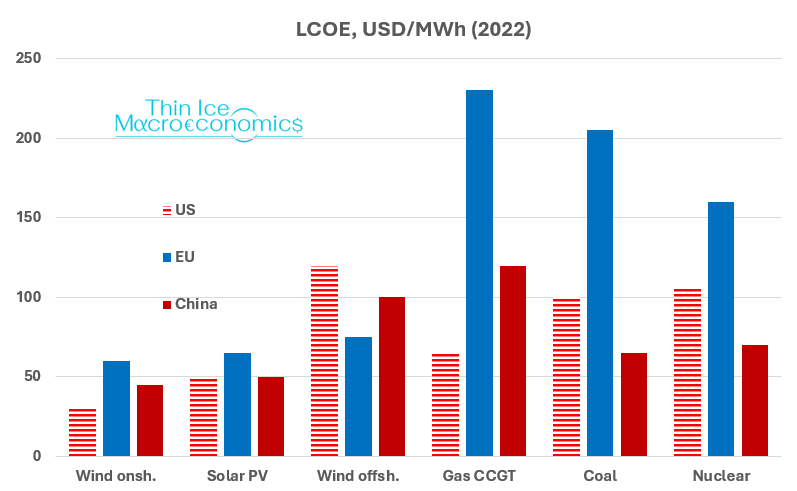
source: Thin Ice Macroeconomics based on data from the 2023 WEO by the IEA
Jargon alert: what the chart above shows is estimates of the so-called “levelized cost” of energy (LCOE).
The LCOE is the price (per unit of electricity) at which the present discounted value (PDV) of the revenue from generating electricity with a given technology over the lifetime of a plant is equal to the PDV of costs (for the geeks, the formula is here).
The costs include: capital; operation and maintenance; fuel (“feedstock”); the cost of carbon (if applicable); and any cost of waste management and decommissioning.
Essentially, the LCOE can be thought of as the break-even price of electricity generation with a given technology. It’s the default metric used to compare different generation technologies.
What the chart confirms is that renewables - certainly onshore wind and solar PV - is the cost-minimising technology already, and cheaper than electricity generation from hydrocarbons. And that’s true across the major economies (polluters).
(No doubt the EU numbers for gas have been distorted by the enormous price spikes we saw in the European market due to Russia’s aggression against Ukraine back in 2022. Still: onshore wind, and solar PV, beat gas in both the US and China, while the LCOE for offshore wind is below the one for gas in China.)
Let me level with you
Now, fellow substacker
points out that LCOE is a flawed metric.Why? It turns out that LCOE can be problematic when comparing energy sources like fossil fuels, from which electricity can be generated at any time (“dispatchable” technologies in the jargon), with intermittent sources like wind and solar PV.
Worse, it can even distort the comparison between wind and solar PV.
Intermittency strikes again!
To understand why intermittency is a problem for LCOE comparisons, we need to take a slight detour and delve a bit deeper into the economics of electricity. (I will do my best to present everything in plain English but if I fail and something’s unclear, please leave a comment asking for clarification!).
From science to economics
First of all, how important is intermittency in practice? As an example, the chart below shows actual electricity production from wind energy as a share of installed capacity.
Installed capacity is an indication of the potential amount of power a wind farm could generate if the wind blows all the time. The ratio of actual generation to installed capacity is usually referred to as the capacity factor.
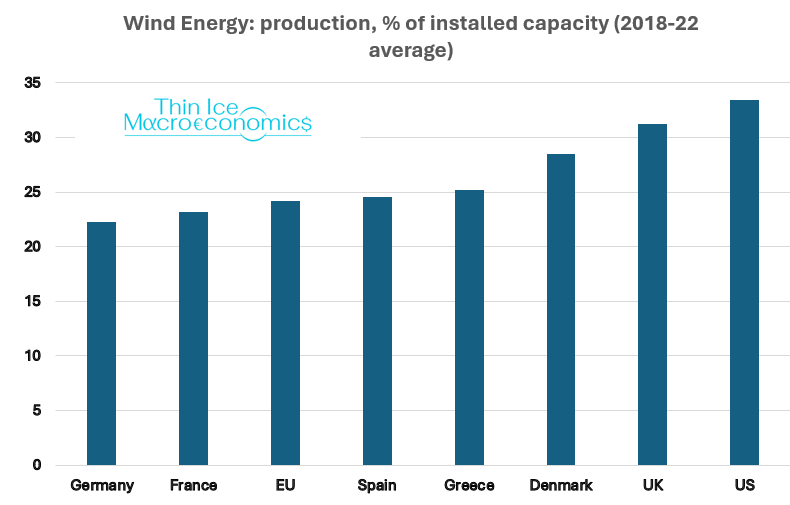
source: Thin Ice Macroeconomics calculations based on data from IRENA
That the capacity factor for wind is around 30% may help in understanding why free wind and solar power do not equate to zero energy cost.
At times when the sun shines or the wind blows, the cost of generating one more unit of electricity is indeed essentially zero. However, because of intermittency, ensuring on-demand electricity is always available requires capacity to generate electricity from other sources. Building and maintaining such capacity is costly.
(Note that whether and how much other capacity is needed will generally also depend on local factors. For example, in latitudes where sunshine is reliably abundant, intermittency is less of an issue.)
Electrifying economics
From an economics perspective, the problem with the notion that free wind and solar implies zero energy cost is that it confuses the marginal cost of electricity – the cost per additional unit of energy produced when renewable sources are available – with the average cost.
The latter includes the costs (per unit produced) not only of installing renewable energy capacity, but also of the other generation capacity required for when renewables cannot cover demand (sometimes called “integration costs”).
Essentially, when it comes to integrating renewables into our energy systems, we need to take a system view on costs, rather than the view of individual generation technologies, which is what the LCOE does.
In particular, integration costs include:
Grid. The location of generation and the point of consumption may be geographically far apart. That implies costs for grid construction to join up, say, Scotland’s generation capacity with England’s demand.
Backup power plants. The cost of keeping backup power plants on standby to ensure reliable supply of electricity (recall that demand and supply must be balanced at all times to ensure grid stability).
Flexibility of power plants. When wind and/or sunshine is abundant, generation from the existing stock of (so-called “thermal”) plants is squeezed. In economics terms, this lowers the utilization of the existing capital stock below optimal (cost-minimal) levels, increasing the average generation cost of those plants. (In the long run, some of this cost can be avoided as the structure of the remaining generation is optimized around renewables.)
Overproduction. At times of high renewables production, the market price of the electricity generated can be very low - even negative (as is the case at the time of writing in Germany). Overproduction may need to be curtailed, which lowers the effective capacity factor and increases the average cost of generation from renewables. This becomes more of a problem as the penetration of renewables increases.
Storage capacity to absorb excess renewables production needs to be built and maintained.
Putting the value into LCOE
The proof of every pudding is in the eating. How much does the system view change our conclusions on the relative costs of renewables vs hydrocarbons?
The IEA computes a metric which incorporates the above considerations, the value-adjusted LCOE (VALCOE). It’s called value-adjusted because it integrates the value a given generation technology adds to the system, for example because the technology increases the reliability of electricity generation.
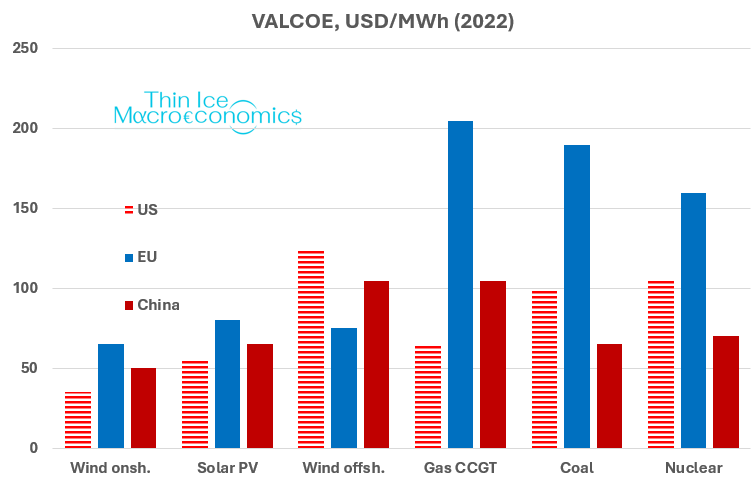
source: Thin Ice Macroeconomics based on data from the 2023 WEO by the IEA
Turns out the conclusions don’t really change. Onshore wind and solar PV have the edge across countries, offshore wind is level (excuse the pun) with gas in China, although not the US.
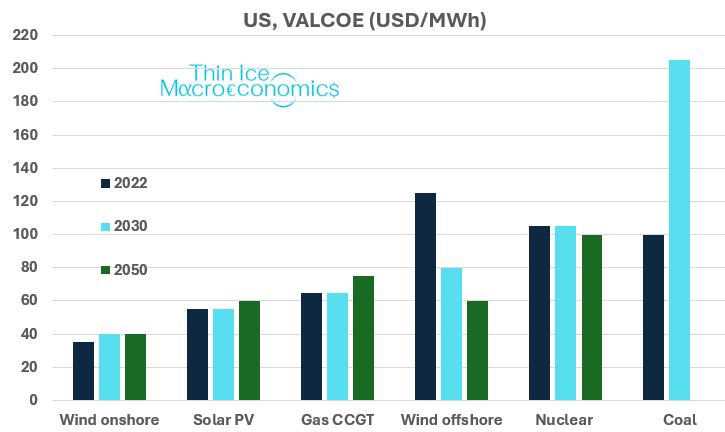
Another way of slicing and dicing this data is to look at the evolution of VALCOE over time for a given country.
Let’s look at the US. Onshore wind and solar PV are the winners. And over time, offshore wind is going to catch up (or rather, down) with gas over time - even undercutting it by 2050. It’s also projected to leave nuclear power far behind.
source: Thin Ice Macroeconomics based on data from the 2023 WEO by the IEA
Conclusion
What spurred me to look into these things a while back was the statement that renewables would imply zero cost of energy (eventually), as wind and sun are free - as an economist, I smelt a rat! Then there’s the default partisan rejection of renewables in some other quarters.
Now, my dad always used to tell me that I had to reach my own conclusions in life.
It turns out that intermittency is indeed important, but less tough a nut to crack than I thought. When one looks at the costs of different technologies - properly accounted for on a system level - renewables do have an edge over fossil fuels, thanks to technology and economies of scale.
That in itself may not be enough to avert a climate catastrophe, but it’s a good position to be in at this stage of the game.
Excellent post, Spyros. I may come back with more serious comments later, but for now I can't resist a flippant quip: "in latitudes where sunshine is reliably abundant, intermittency is less of an issue"...except when you want to turn on the lights or watch TV after sunset... Just a silly summer joke, nothing to do with the substance of the argument.
Also, I will point out that one of my main concerns still stands: until we resolve the energy storage issue in a cost-effective way, we still need fossil fuels. So readers should not come to the conclusion that, since renewables have a lower LCOE, we can happily cruise to net-zero.